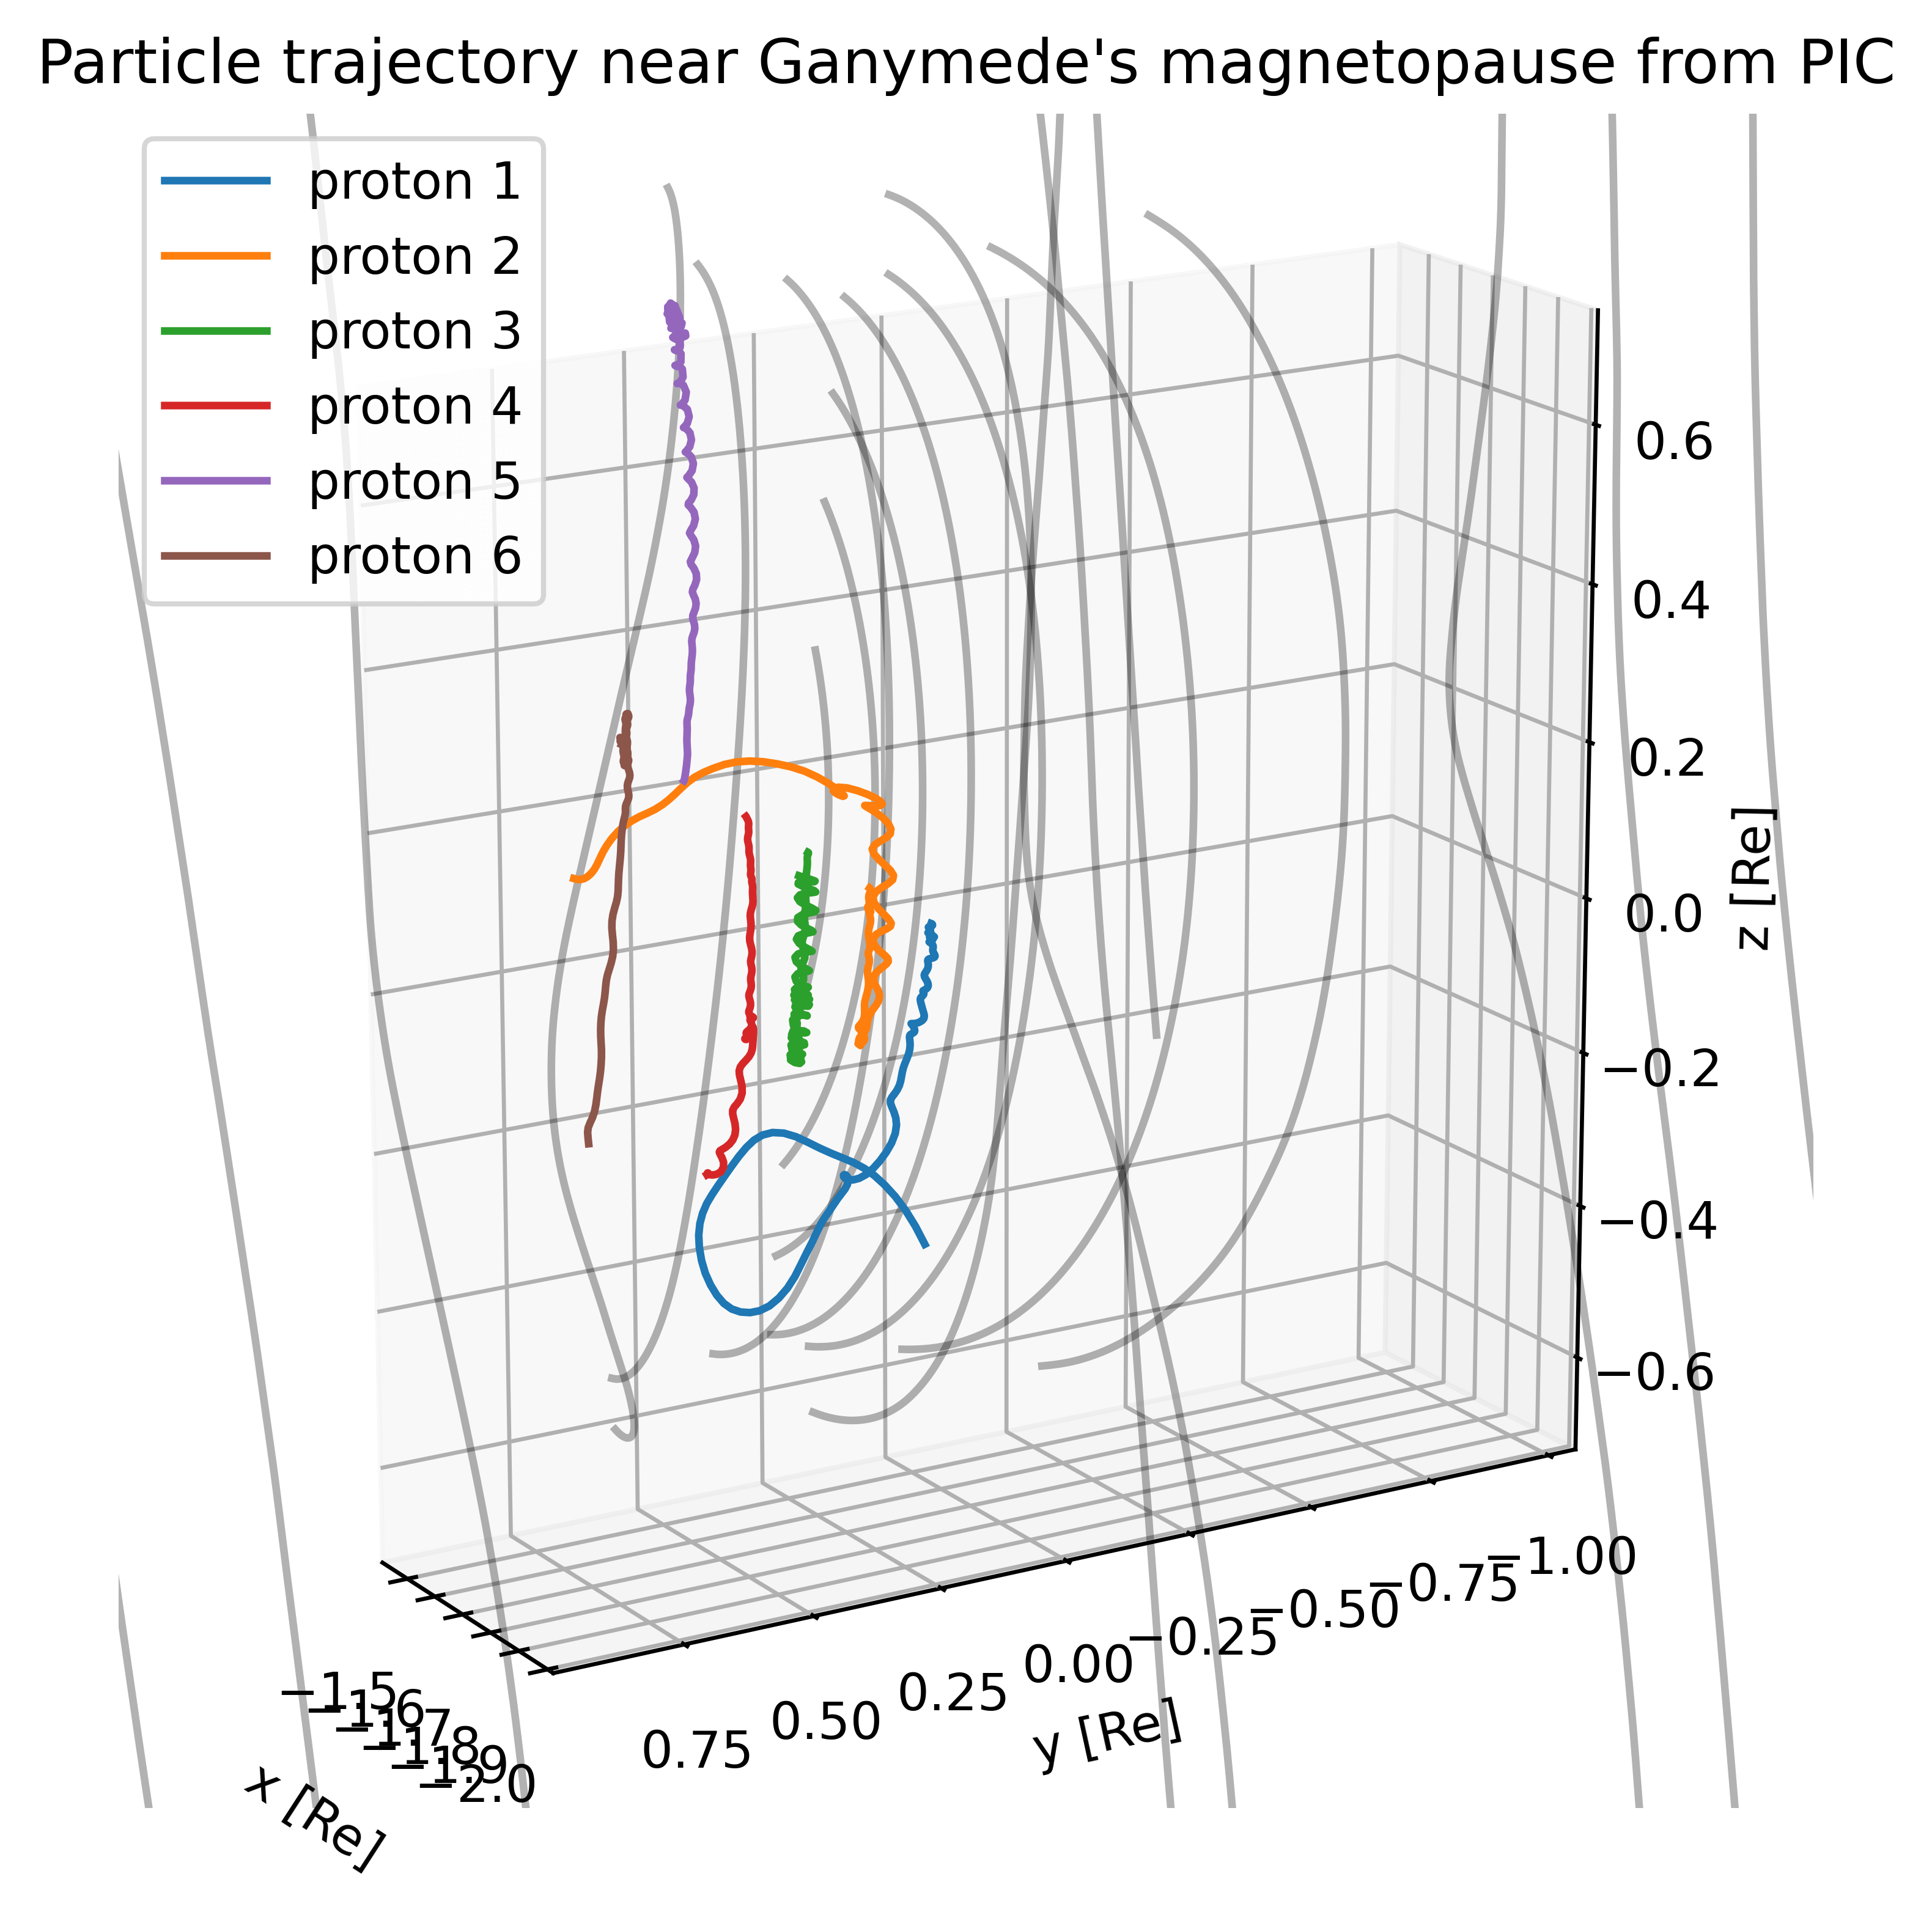
Tracing Particle from PIC
This example shows how to trace charged particles in the structured SWMF outputs from an MHD-EPIC simulation of Ganymede. For more details about the field file format, please checkout Batsrus.jl.
julia
using Batsrus
using TestParticle
using OrdinaryDiffEq
using FieldTracer
using PyPlot

## Utility functions

function initial_conditions(i)
    j = i - 1
    return [x[xc_], y[yc_ + j], z[zc_], Uix[xc_, yc_ + j, zc_], Uiy[xc_, yc_ + j, zc_], Uiz[xc_, yc_ + j, zc_]]
end

"Set initial conditions."
function prob_func(prob, ctx)
    return remake(prob, u0 = initial_conditions(ctx.sim_id))
end

## Data processing

filename = "3d_var_region0_0_t00002500_n00106468.out"
data = readdata(filename)

var = getvars(data, ["Bx", "By", "Bz", "Ex", "Ey", "Ez", "uxs0", "uys0", "uzs0", "uxs1", "uys1", "uzs1"])

const RG = 2634.0e3 # [m]

x = range(extrema(data.x[:, :, :, 1])..., length = size(data.x, 1)) .* RG
y = range(extrema(data.x[:, :, :, 2])..., length = size(data.x, 2)) .* RG
z = range(extrema(data.x[:, :, :, 3])..., length = size(data.x, 3)) .* RG
B = zeros(Float32, 3, length(x), length(y), length(z)) # [T]
E = zeros(Float32, 3, length(x), length(y), length(z)) # [V/m]

# Convert into SI units
B[1, :, :, :] .= var["Bx"] .* 1.0e-9
B[2, :, :, :] .= var["By"] .* 1.0e-9
B[3, :, :, :] .= var["Bz"] .* 1.0e-9
E[1, :, :, :] .= var["Ex"] .* 1.0e-6
E[2, :, :, :] .= var["Ey"] .* 1.0e-6
E[3, :, :, :] .= var["Ez"] .* 1.0e-6

## Initial conditions

Uex, Uey, Uez = var["uxs0"] .* 1.0e3, var["uys0"] .* 1.0e3, var["uzs0"] .* 1.0e3
Uix, Uiy, Uiz = var["uxs1"] .* 1.0e3, var["uys1"] .* 1.0e3, var["uzs1"] .* 1.0e3

xc_ = floor(Int, length(x) / 2) + 1
yc_ = floor(Int, length(y) / 2) + 1
zc_ = floor(Int, length(z) / 2) + 1

stateinit_e = [x[xc_], y[yc_], z[zc_], Uex[xc_, yc_, zc_], Uey[xc_, yc_, zc_], Uez[xc_, yc_, zc_]]
stateinit_p = [x[xc_], y[yc_], z[zc_], Uix[xc_, yc_, zc_], Uiy[xc_, yc_, zc_], Uiz[xc_, yc_, zc_]]

param_electron = prepare(x, y, z, E, B, species = Electron)
tspan_electron = (0.0, 0.1)

param_proton = prepare(x, y, z, E, B, species = Proton)
tspan_proton = (0.0, 10.0)
trajectories = 5

prob_p = ODEProblem(trace!, stateinit_p, tspan_proton, param_proton)
ensemble_prob = EnsembleProblem(prob_p, prob_func = prob_func)
sol_p = solve(ensemble_prob, Vern9(), EnsembleThreads(); trajectories)

## Visualization

using3D()
fig = plt.figure(figsize = (10, 6))
ax = fig.gca(projection = "3d")

## Field tracing

for i in 1:10:length(x)
    xs, ys, zs = x[i], 0.0, 0.0
    x1, y1, z1 = trace(B[1, :, :, :], B[2, :, :, :], B[3, :, :, :], xs, ys, zs, x, y, z, ds = 0.2, maxstep = 1000)
    line = ax.plot(x1 ./ RG, y1 ./ RG, z1 ./ RG, "k-", alpha = 0.3)
end

for i in 1:10:length(y)
    xs, ys, zs = x[xc_], y[i], z[zc_]
    x1, y1, z1 = trace(B[1, :, :, :], B[2, :, :, :], B[3, :, :, :], xs, ys, zs, x, y, z, ds = 0.2, maxstep = 1000)
    line = ax.plot(x1 ./ RG, y1 ./ RG, z1 ./ RG, "k-", alpha = 0.3)
end

n = 200 # number of timepoints

ts = range(0, stop = tspan_proton[2], length = n)
for i in 1:trajectories
    if sol_p[i].t[end] < tspan_proton[2]
        ts⁺ = range(0, stop = sol_p[i].t[end], length = n)
        ax.plot(sol_p[i](ts⁺, idxs = 1) ./ RG, sol_p[i](ts⁺, idxs = 2) ./ RG, sol_p[i](ts⁺, idxs = 3) ./ RG, label = "proton $i", lw = 1.5)
    else
        ax.plot(sol_p[i](ts, idxs = 1) ./ RG, sol_p[i](ts, idxs = 2) ./ RG, sol_p[i](ts, idxs = 3) ./ RG, label = "proton $i", lw = 1.5)
    end
end

#ax.plot(sol_p[1,:], sol_p[2,:], sol_p[3,:], label="proton")

ax.legend()
title("Particle trajectory near Ganymede's magnetopause from PIC")
xlabel("x [Rg]")
ylabel("y [Rg]")
zlabel("z [Rg]")

ax.set_box_aspect([1.17, 4, 4])