Proton in Z-pinch
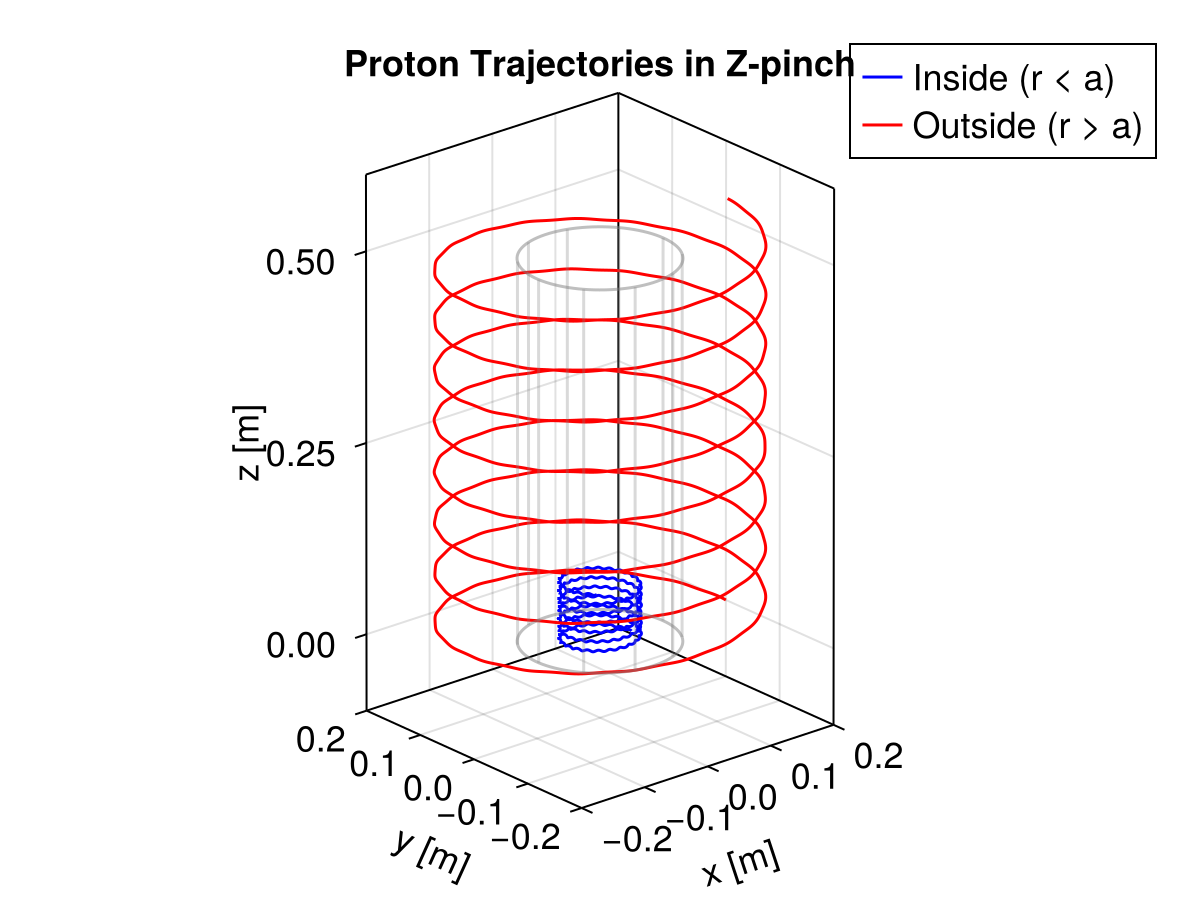
This example traces protons in a Z-pinch magnetic configuration. The Z-pinch consists of a current flowing along the z-axis, creating an azimuthal magnetic field. Reference: Z-pinch
julia
using TestParticle, OrdinaryDiffEq, StaticArrays
import TestParticle as TP
import Magnetostatics as MS
using CairoMakie

### Initialize Field

# Z-pinch parameters
const I_current = 1.0e6 # Current [A]
const a_wire = 0.1 # Radius of the wire [m]

getB(xu) = MS.getB_zpinch(xu[1], xu[2], xu[3], I_current, a_wire)
getE = ZeroField()

### Initialize Particles

# Protons
const m = TP.mᵢ
const q = TP.qᵢ
const c = TP.c

# Initial state
# Position inside the wire to see internal behavior, or outside.
# Let's put one outside and one inside.
r0_in = [0.05, 0.0, 0.0]
v0_in = [0.0, 2.0e5, 1.0e5] # Spiral

r0_out = [0.2, 0.0, 0.0]
v0_out = [0.0, 1.0e6, 1.0e5] # Drift

stateinit_in = [r0_in..., v0_in...]
stateinit_out = [r0_out..., v0_out...]

param = prepare(getE, getB; species = Proton)
tspan = (0.0, 1.0e-5)

prob_in = ODEProblem(trace!, stateinit_in, tspan, param)
prob_out = ODEProblem(trace!, stateinit_out, tspan, param)

sol_in = solve(prob_in, Vern7(), dt = 1.0e-6)
sol_out = solve(prob_out, Vern7(), dt = 1.0e-6);
Visualization
julia
f = Figure(fontsize = 18)
ax = Axis3(
    f[1, 1],
    title = "Proton Trajectories in Z-pinch",
    xlabel = "x [m]",
    ylabel = "y [m]",
    zlabel = "z [m]",
    aspect = :data,
    limits = (-0.2, 0.2, -0.2, 0.2, -0.1, 0.6)
)

lines!(ax, sol_in, idxs = (1, 2, 3), label = "Inside (r < a)", color = :blue)
lines!(ax, sol_out, idxs = (1, 2, 3), label = "Outside (r > a)", color = :red)

# Plot the wire boundary
θ = range(0, 2π, length = 100)
zw = range(0.0, 0.5, length = 2)
x_wire = a_wire .* cos.(θ)
y_wire = a_wire .* sin.(θ)

# Wire cylinder visualization (wireframe)
lines!(ax, x_wire, y_wire, fill(zw[1], length(θ)), color = (:gray, 0.5))
lines!(ax, x_wire, y_wire, fill(zw[2], length(θ)), color = (:gray, 0.5))
# Vertical lines for wire
for i in 1:10:100
    lines!(
        ax, [x_wire[i], x_wire[i]], [y_wire[i], y_wire[i]],
        [zw[1], zw[2]], color = (:gray, 0.3)
    )
end

axislegend(ax, backgroundcolor = :transparent)